So what low-down bottom line do I share with my students along this Data Analysis track?
- That the Python ecosystem is but one of many and many of the tools we're learning (LaTeX, regexes...) bridge our respective communities e.g. Jupyter celebrates computer languages Julia, Python, and R, all early adopters of this common browser based interface to a running kernel
- That interactive dashboard type data displays are not necessarily tracking anything in real time, but many of them are, and real time tracking is an expectation many will have; so best to bone up on the relevant tools.
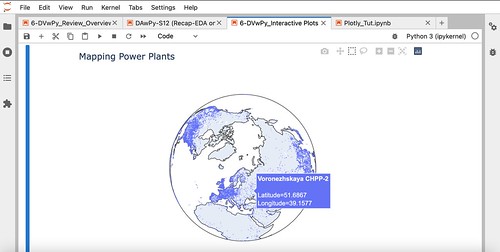
I focus a lot on GIS type displays as integral with data visualization i.e. displays driven by latitude / longitude.
I'm not off topic, therefore, sharing about the various projections, and especially the demented Mercator, with Alaska and Greenland so grossly distorted.
There's a time and a place for it, but we're not bound by it, would be the obvious message.
We're beginners and so establish our chops using well-known favorites:
- seaborn
- pandas
- matplotlib
- numpy
but then we jump into pyplot and dash for a day, to confirm the heuristics we've been learning are largely transferable. Pyplot is a lot like seaborn and dash depends on Flash, which we also tour, including via my own Flask-teaching website.
In some ways I'm in Coding with Kids mode in that I'm not in upper management. I punch in and punch out and uphold my end of the bargain.
Meanwhile, I bring whatever curriculum development skills to bear, adding to what's already a substantive and well-organized tour of an emerging terrain.

